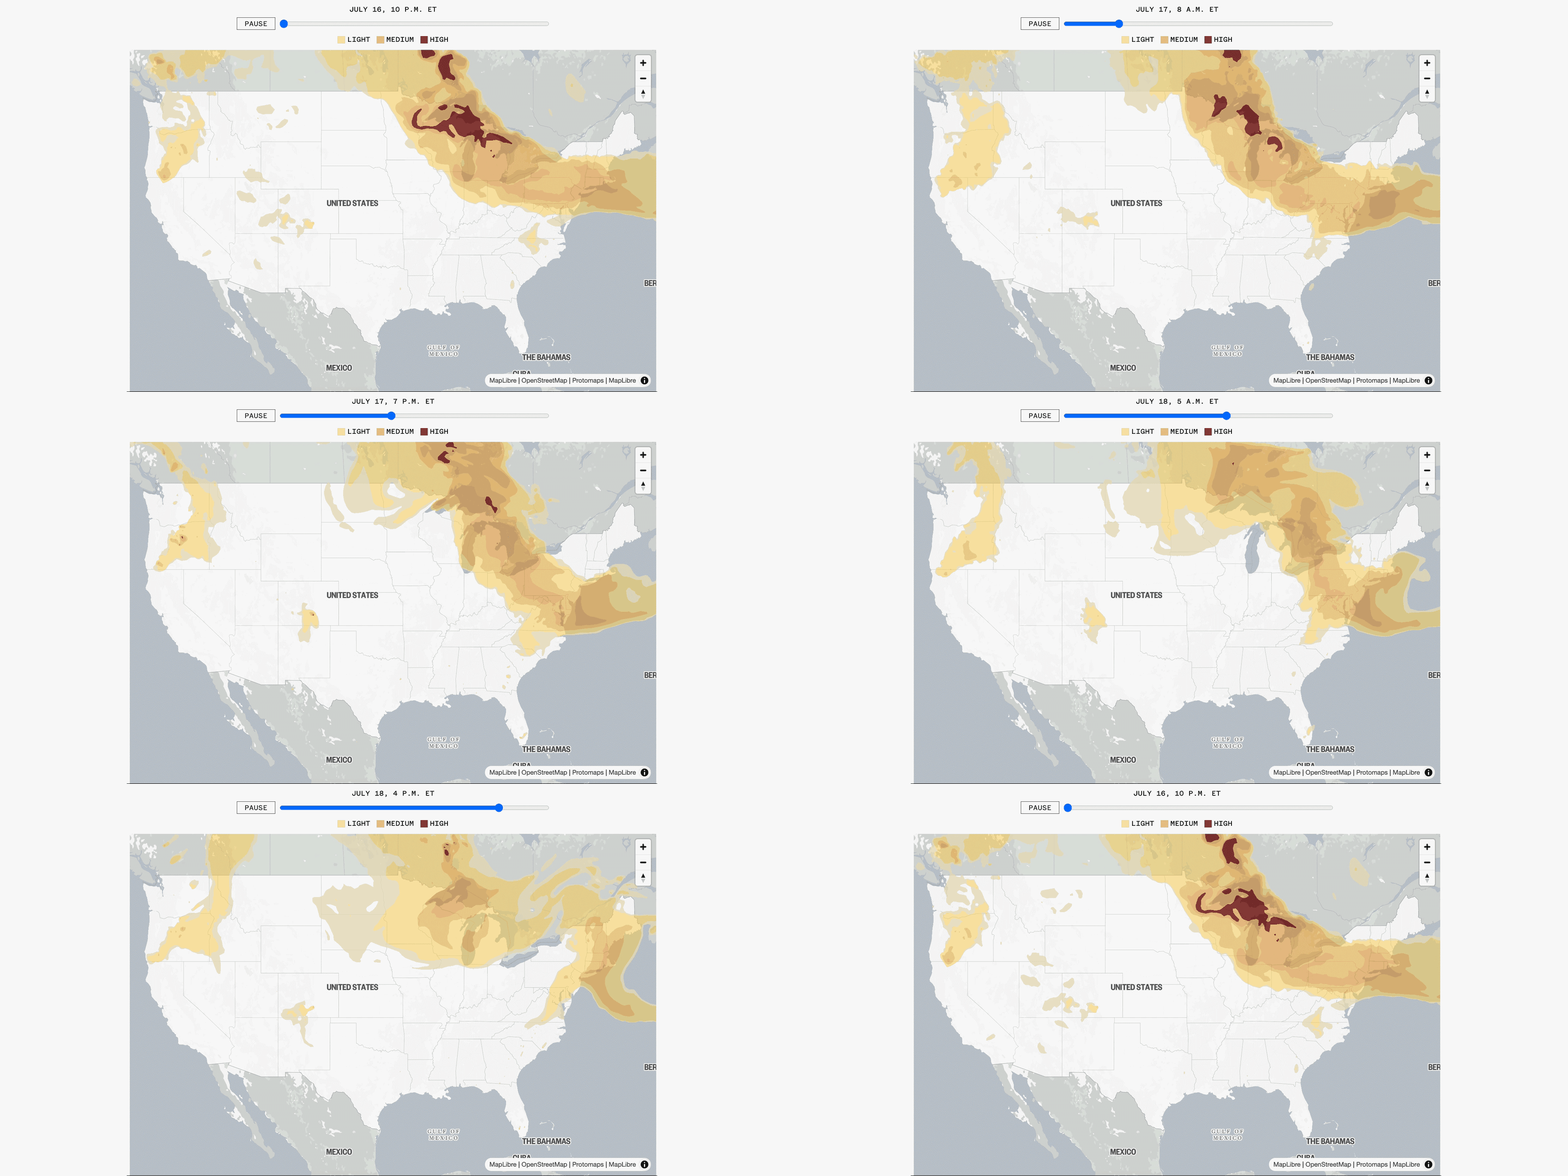
The annual intrusion of wildfire smoke into the Midwest and northern United States is not a random weather event; it is a predictable atmospheric pipeline governed by synoptic-scale meteorology and topographies. While standard consumer weather reports treat smoke plumes as erratic visual anomalies on a map, atmospheric transport operates on a rigid cost function determined by planetary boundary layer dynamics, upper-level steering currents, and fuel chemistry. Understanding the trajectory and health risks of a smoke event requires breaking down the plume into its structural mechanics.
Evaluating the impact of these transboundary air pollution events requires moving past raw Air Quality Index (AQI) values. AQI is a lagging, aggregated metric that frequently obscures the real-time physical mechanisms driving respiratory risk. To accurately project how smoke from western Canadian or domestic fires will alter the air quality of the Midwest, analysts must evaluate three foundational variables: plume injection height, downwind subsidence, and fine particulate chemical evolution.
The Tri-Particle Vector Framework of Wildfire Smoke
The trajectory of a smoke plume depends heavily on the thermal dynamics at the point of ignition. This process can be broken down into three distinct phases that dictate whether a smoke event will remain an elevated haze or descend into a localized public health crisis.
[Pyrocumulonimbus Injection] -> [Synoptic Transport (Jet Stream)] -> [Subsidence & Boundary Layer Entrainment]
1. Thermal Buoyancy and Injection Height
The initial altitude of a smoke plume is determined by the fire's heat release rate. High-intensity wildfires generate pyrocumulonimbus (pyroCb) clouds, which function as thermal engines. If a fire burns with sufficient intensity, it breaches the local planetary boundary layer (PBL), injecting particulate matter directly into the free troposphere or even the lower stratosphere.
Smoke trapped below the PBL (typically under 2,000 meters) remains a localized or regional issue, subject to rapid ground friction and terrain deposition. Conversely, smoke injected into the free troposphere escapes ground-level friction, entering high-velocity steering currents that transport fine particulate matter thousands of miles east-southeast toward the Great Lakes and Midwest plains.
2. Synoptic Steering and the Omega Block
Once transport occurs in the upper atmosphere, the spatial distribution of smoke follows large-scale pressure patterns. The most common driver of prolonged Midwestern smoke inundation is the "Omega Block"—a atmospheric pressure pattern featuring a high-pressure system flanked by two low-pressure troughs.
   Low (West) ---> HIGH PRESSURE (Midwest/Plains) <--- Low (East)
                        |
                        v
            [Persistent Downward Subsidence]
This configuration creates a stagnant atmospheric lid. The high-pressure system forces upper-level air downward. As the smoke-laden air mass from western or northern fires moves along the periphery of this block, it is drawn into the descending zone of the high-pressure system, initiating the next phase of ground-level contamination.
3. Boundary Layer Entrainment and Subsidence
The transition from an elevated, visually hazy sky to hazardous ground-level breathing conditions occurs via boundary layer entrainment. During the day, solar radiation heats the Earth's surface, causing the planetary boundary layer to expand upward. If this expanding boundary layer encounters an elevated smoke plume aloft, it mechanically mixes the upper-level particulate matter down to the surface. This diurnal mixing explains why ground-level PM2.5 concentrations often spike sharply in the late morning and early afternoon, even when horizontal wind speeds appear calm.
The Chemical Degradation of Air Quality: Beyond PM2.5
Fine particulate matter ($PM_{2.5}$) is the primary metric used to quantify smoke density, but it is not a static variable. As smoke travels from its source to the northern U.S., it undergoes physical and chemical transformations that alter its toxicity and behavior.
Atmospheric Aging and Secondary Organic Aerosols
Fresh wildfire smoke consists primarily of primary organic aerosols (POA) and black carbon. As these particles travel downwind over 48 to 72 hours, they are exposed to solar ultraviolet radiation and atmospheric oxidants like hydroxyl radicals ($OH$). This exposure triggers photo-oxidation, transforming volatile organic compounds (VOCs) within the plume into Secondary Organic Aerosols (SOAs).
This atmospheric aging process often causes the total mass of $PM_{2.5}$ to increase downwind from the fire, rather than diluting as one might expect. The smoke arriving in Chicago or Minneapolis is often chemically distinct from, and occasionally more oxidative than, the smoke sampled near the source in Alberta or the Pacific Northwest.
The Ground-Level Ozone Catalyst
Wildfire plumes carry massive quantities of nitrogen oxides ($NO_x$) and VOCs. When these precursors mix with urban pollution already present in Midwestern metropolitan areas under hot, stagnant summer conditions, they act as a catalyst for ground-level ozone ($O_3$) formation. The intersection of wildfire smoke and urban traffic creates a compounding chemical hazard, yields a multi-pollutant environment where $PM_{2.5}$ and ozone simultaneously breach federal safety standards.
Quantifying the Economic and Operational Bottlenecks
The structural impacts of regional smoke transport extend beyond public health, creating direct disruptions across critical industrial sectors.
HVAC System Saturation
Standard commercial building HVAC systems are designed to handle ambient urban dust, typically utilizing MERV 8 to MERV 11 filtration media. These filters possess low capture efficiencies for sub-micron wildfire particles. When a smoke plume covers a region, commercial building managers face an immediate operational trade-off:
- The Filtration Bottleneck: Upgrading to MERV 13 or HEPA filtration increases static pressure drops across the ventilation system.
- The Energy Cost: Higher static pressure forces supply fans to consume more electricity to maintain mandated air exchange rates.
- The Alternative Risk: Restricting outdoor air intake preserves filter life and indoor air quality but leads to carbon dioxide ($CO_2$) accumulation and building depressurization, which pulls unconditioned, smoky air through structural gaps.
Agricultural Yield Penalties
The Midwest agricultural belt faces a direct challenge from prolonged smoke cover. High concentrations of elevated smoke alter the Solar Radiation Index. While smoke scatters light—sometimes increasing diffuse radiation, which can penetrate deeper into crop canopies—it simultaneously reduces total photosynthetically active radiation (PAR). During critical corn and soybean reproductive stages in July and August, a 10% to 15% reduction in PAR caused by persistent smoke haze limits photosynthetic capacity and lowers final crop yields.
Limitations of Current Predictive Architecture
Deploying effective risk-mitigation strategies requires recognizing where current smoke forecasting models fall short.
[Satellites detect thermal anomalies] -> [Misses under-canopy/smoldering fires] -> [Underestimated source terms] -> [Inaccurate downwind PM2.5 forecasts]
Most predictive systems rely on satellite detection of Moderate Resolution Imaging Spectroradiometer (MODIS) or Visible Infrared Imaging Radiometer Suite (VIIRS) thermal anomalies to calculate the initial fire radiative power (FRP). This approach introduces several systematic vulnerabilities:
- Cloud and Canopy Shielding: Thick cloud cover or dense forest canopies obscure active fires from satellite sensors, leading models to underestimate the initial fuel consumption rate and source term.
- Diurnal Orbit Gaps: Polar-orbiting satellites provide high-resolution data but only pass over specific coordinates a few times per day, frequently missing rapid afternoon flare-ups that dictate plume injection height.
- Smoldering Phase Miscalculation: Satellites excel at detecting flaming combustion but struggle to quantify low-temperature smoldering phases, which produce higher ratios of carbon monoxide and primary organic aerosols per unit of fuel burned.
Strategic Protocol for Environmental Operations
Industrial, municipal, and healthcare operators cannot rely on passive monitoring during an active smoke transport event. Mitigating the impact of a smoke plume requires deploying a tiered operational framework.
+-----------------------------------------------------------------------+
|                PHASE 1: PROACTIVE SENSOR ALIGNMENT                   |
|  Calibrate optical PM2.5 sensors with regional Federal Reference       |
|  Method (FRM) monitors to correct for smoke particle density variances|
+-----------------------------------------------------------------------+
                                   |
                                   v
+-----------------------------------------------------------------------+
|               PHASE 2: DYNAMIC VENTILATION MODULATION                 |
|  Deploy MERV 13+ filtration; reduce outdoor air intake to minimum     |
|  required settings while maintaining slight positive building pressure|
+-----------------------------------------------------------------------+
                                   |
                                   v
+-----------------------------------------------------------------------+
|             PHASE 3: MULTI-POLLUTANT HEALTH DEPLOYMENT                |
|  Issue targeted respiratory protection based on co-pollutant surges   |
|  (PM2.5 + Ozone), shifting focus from raw AQI to particle composition  |
+-----------------------------------------------------------------------+
When managing regional air quality degradation, organizations must transition from reactive observation to predictive engineering. Ambient air quality monitoring networks should prioritize real-time mass-concentration sensors over generic air quality index calculations.
Facilities must run building pressurization tests prior to high-risk summer months to locate structural leaks that risk bypass contamination. For supply chain and logistics networks operating across the northern U.S., scheduling outdoor activities around afternoon boundary layer entrainment cycles minimizes direct workforce exposure while optimizing operational uptime. This systematic approach ensures operations remain resilient against the realities of transboundary wildfire smoke transport.