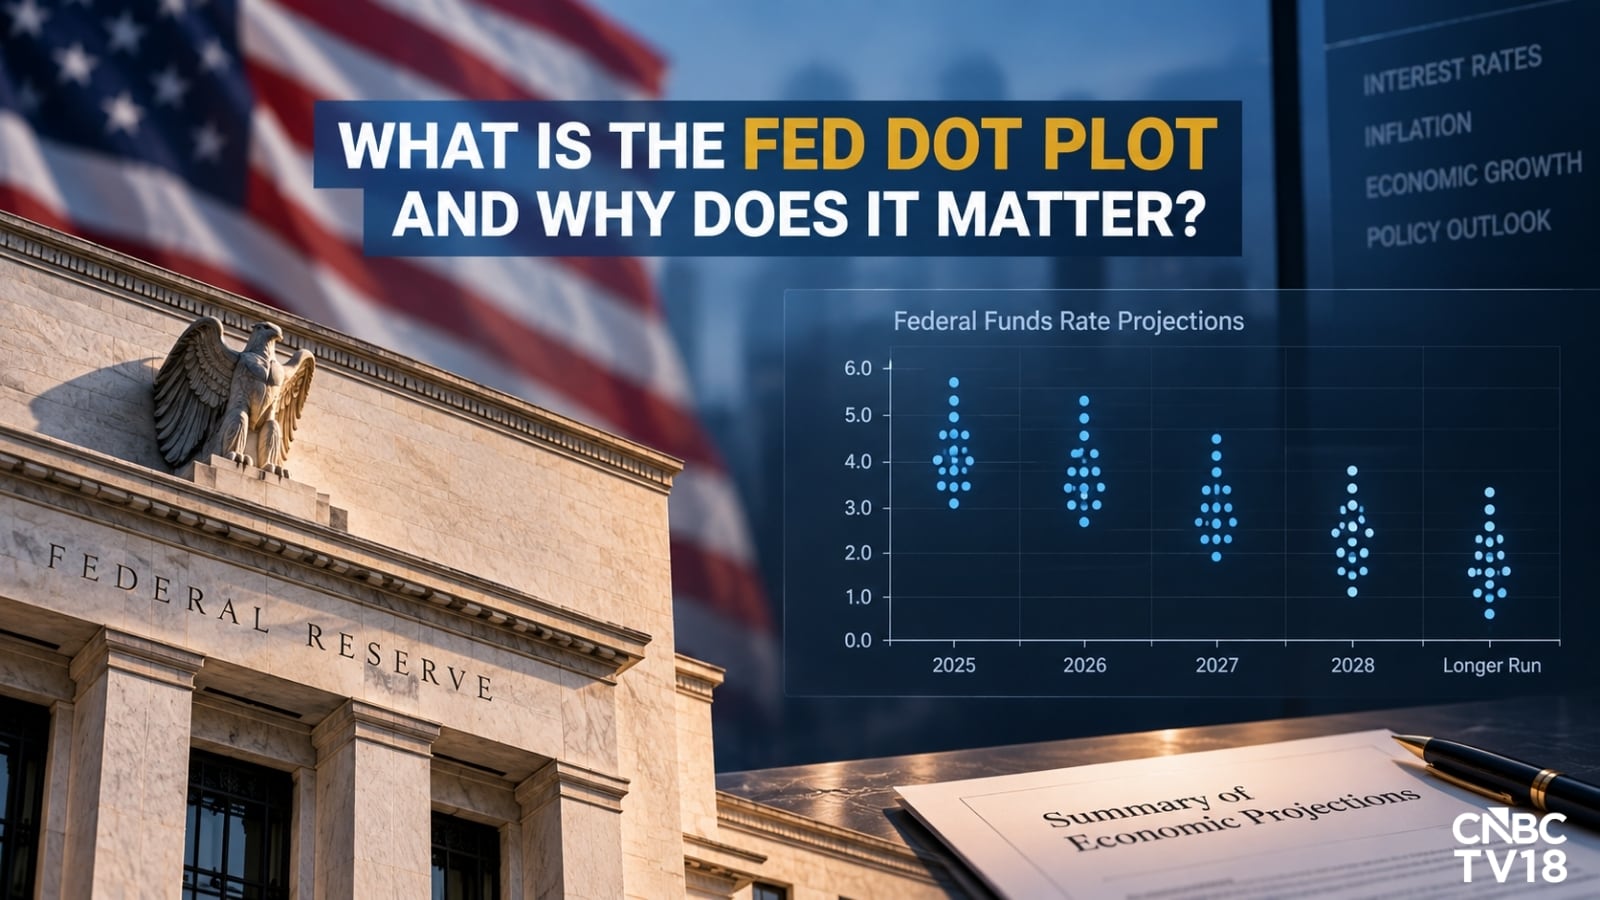
Every quarter, financial television anchors lose their minds over a scatterplot. Grown analysts scribble furiously on digital whiteboards, parsing whether a single dot moved twenty-five basis points higher for late next year. Portfolio managers reallocate billions based on this collective exercise in economic astrology. They call it the Federal Reserve dot plot. I call it an institutional hallucination packaged as monetary guidance.
The lazy consensus across financial media is simple: the dot plot serves as a forward-looking window into the minds of central bankers, offering investors a reliable compass for future interest rate paths. This narrative is comforting. It gives algorithmic traders something to digest and gives talking heads something to fill airtime with during a flat market session. It is also completely, dangerously wrong.
The dot plot is not a forecast. It is a political opinion poll conducted among nineteen people who are structurally incentivized to look like they know what happens next, despite operating in a complex adaptive system where predictability is a myth. When you treat a scatterplot of anonymous guesses as an operational roadmap, you are not managing risk. You are participating in a multi-trillion-dollar confidence game.
The Anatomy of an Institutional Fiction
To understand why the dot plot fails, you must examine how it is constructed. Four times a year, the members of the Federal Open Market Committee and the regional Fed presidents submit their individual projections for the federal funds rate at the end of the current year, the next three years, and the longer run. These submissions are completely anonymous.
Think about the perverse incentives built into this system. If a regional president publishes a dot that diverges wildly from market pricing, they face an immediate barrage of media scrutiny. If their projection proves embarrassing, their credibility takes a hit. Consequently, the dots exhibit a severe case of herding behavior. They cluster around whatever consensus narrative happens to dominate the Eccles Building on any given Tuesday.
Furthermore, these projections are non-binding. There is zero legal, operational, or institutional penalty for being entirely wrong. If a central banker predicts rates will sit at three percent in twenty-four months, and reality forces rates to five percent due to an exogenous shock, nothing happens. They simply move their dots at the next meeting as if the previous quarter's prediction never existed. Try running a hedge fund or a corporate treasury with that level of unaccountable forecasting accuracy, and you will be bankrupt inside of two quarters. Yet, the financial press treats these shifting ink blots as immutable laws of fiscal physics.
A Track Record Built on Blind Spots
Let us look at the historical data rather than the theoretical fantasies. Look back at the economic turbulence of the post-pandemic era. In late 2021, as inflation began running hot and supply chains fractured globally, the median dot plot still insisted that interest rates would remain near zero for years. That single institutional miscalculation forced the central bank into the most aggressive, rapid monetary tightening cycle in forty decades, shattering regional banks, crushing long-duration fixed-income portfolios, and inflicting massive pain on leveraged corporate balance sheets.
The dot plot did not warn anyone about that shock. It missed the inflection point entirely because it is fundamentally backward-looking and structurally blind to non-linear feedback loops. When inflation accelerated, the dots scrambled upward month after month, chasing reality rather than leading it. The central bank was reacting to lagging economic indicators while pretending their forward-looking dots held predictive value.
Imagine a pilot flying a commercial airliner through a Category 5 hurricane while checking a weather report that was generated three weeks ago by a committee of municipal politicians. That is precisely how institutional asset managers navigate interest rate cycles using the dot plot. They are staring at a static snapshot while the underlying macroeconomic tectonic plates shift beneath their feet.
The Psychology of Market Co-Dependency
Why do sophisticated market participants continue to play along with this charade? The answer lies in institutional self-preservation.
Asset management firms operate under intense pressure to explain every basis point of underperformance or outperformance to their institutional clients. If a large pension fund or endowment manager loses money on a bond bet, they cannot simply tell their board that markets are chaotic and impossible to forecast with precision. That honesty gets you fired. Instead, they need a scapegoat. They need an external authority figure to blame for their positioning errors.
The Federal Reserve provides that convenient shield. When a macro hedge fund blows up because they misjudged the duration risk on their portfolio, the portfolio manager does not point inward at their flawed risk models. They point outward at the dot plot. They claim the central bank "misled" them by changing the dots.
This symbiotic relationship creates a bizarre theater. The Fed wants to jawbone the market without actually moving rates, so they use the dot plot as a psychological pressure valve to tighten or loosen financial conditions through speech rather than policy actions. Wall Street plays along because the resulting volatility generates trading commissions, advisory fees, and plausible deniability for poor risk management. Everyone wins except the end investor whose capital is being whipped around by an elaborate psychological op.
Reading the Variance, Not the Median
If you refuse to ignore the dot plot entirely—because your compliance mandate or investment committee forces you to look at it—you must at least learn to read it like an insider rather than a retail consumer.
Stop looking at the median dot. The median is a statistical illusion designed to smooth out disagreements that are actually the most valuable data points on the chart. Instead, focus entirely on the dispersion and the standard deviation of the dots.
When the dots are tightly clustered around a single point, it tells you that the committee possesses a high degree of internal confidence, or more accurately, that groupthink has achieved total dominance within the institution. When the dots scatter across a wide range—where one official sees zero percent rates and another sees six percent rates—the illusion of consensus shatters. That dispersion is the only useful signal the chart provides. It measures the level of internal panic and policy confusion inside the central bank.
A wide dispersion means the committee has lost its anchor. It means the economic data is so noisy and contradictory that even the central planners have no idea what comes next. That is your cue to reduce risk, shorten your duration, and ignore anyone on television who claims they know where the baseline sits.
What to Watch Instead
If the dot plot is a fraudulent roadmap, what should you actually track to navigate the modern interest rate environment?
First, watch real-time corporate credit spreads and short-term liquidity plumbing. The repo market and commercial paper yields tell you the truth about capital scarcity long before nineteen central bankers gather in Washington to update their dots.
Second, monitor structural labor market shifts and supply chain velocity indicators. Inflation is driven by physical bottlenecks, demographic shifts, and fiscal dominance—not by what a central bank bureaucrat hopes the federal funds rate will be in three years.
Third, evaluate balance sheet expansion and contraction. The size of the central bank's asset portfolio dictates asset price inflation far more effectively than any signaling mechanism or interest rate projection. Liquidity drives prices; dots drive headlines.
Stop treating the Federal Reserve like an oracle with direct access to the future. They are reactive, political, and frequently wrong. The moment you stop trading the dots and start trading the underlying economic reality, you stop being the liquidity provider for someone else's institutional theater.